Facilitate and tailor Walter & Lieth climatic diagram drawing
Auman Chan, PhD Candidate
2025-06-18
Source:vignettes/climplot_Intro.Rmd
climplot_Intro.Rmd
climplot aims to collect crucial climate data for global locations and draw the Walter & Lieth climatic diagrams in a more user-friendly and personalized manner.
The main features of the package are:
- The automatic obtainment and arrangement of standardized and reliable data for drawing Walter & Lieth climatic diagrams
- The provision for more parameter to customize the plots and display comprehensive information
The package offers functions for:
- Download and arrange worldwide climate data to draw Walter & Lieth climatic diagram for global locations
- Draw the Walter & Lieth climatic diagram
- Revise the color scheme and information presentation of the diagram
Installing and loading
To install the latest developmental version from github and gitee, you will need the R packages remotes and git2r. If you want
to install the vignettes of this package, please add
build_vignettes = TRUE.
install.packages("remotes")

# from github
remotes::install_github("auman-chan/climplot")
# from gitee
install.packages("git2r")
remotes::install_git("https://gitee.com/auman-chan/climplot.git")

# add vignettes
remotes::install_github("auman-chan/climplot", build_vignettes = TRUE)

remotes::install_git("https://gitee.com/auman-chan/climplot.git",
  build_vignettes = TRUE
)

# add vignettes
remotes::install_github("auman-chan/climplot", build_vignettes = TRUE)

remotes::install_git("https://gitee.com/auman-chan/climplot.git",
  build_vignettes = TRUE
)
Plotting data extraction
The task of searching for and processing climate data from multiple
locations is a challenging endeavor. Function clim_extract
retrieves data from Worldclim Historical
monthly weather data(Version of 30 seconds). These data would be
downloaded automatically according to your locations with package
geodata, and arranged for diagrams visualization.
Location information preparation
In order to extract climate data for specific locations, precise
coordinates are essential. Additionally, the diagram should display
other relevant information such as location names and altitudes.
Therefore, a data.frame containing information of the target locations
is necessary for clim_extract. The imported data.frame must
contain five columns in the following order:
- No: Serial number of the locations
- location: Abbreviation of the locations
- lon: Longitude of the locations in decimal digit (negative numbers indicating west longitude)
- lat: Latitude of the locations in decimal digit (negative numbers indicating south latitude)
- altitude: Altitude of the locations
The data locdata in this package can be an example of
the import data.frame. Other extra columns with information is allowed
behind the columns above, but would be discarded in following
process.
| No | location | lon | lat | altitude | name |
|---|---|---|---|---|---|
| 1 | Motuo | 95.3536 | 29.30420 | 2025 | 墨脱县仁钦崩寺 |
| 2 | Wulianshan | 100.5000 | 24.50000 | 1301 | 无量山自然保护区 |
| 3 | Wawushan | 102.9167 | 29.50000 | 2082 | 四川省眉山市洪雅县瓦屋山 |
| 4 | Leibo | 103.4667 | 28.45000 | 1204 | 四川省凉山州雷波县 |
| 5 | Longcanggou | 102.8333 | 29.61667 | 1764 | 四川省雅安市荥经县龙苍沟国家森林公园 |
| 6 | Jinfoshan | 107.1933 | 29.00017 | 1917 | 重庆市南川区金佛山国家级自然保护区 |
| 7 | Xishui | 106.4667 | 28.30000 | 863 | 贵州省习水良村镇羊化村 |
| 8 | Tonglingshan | 119.8598 | 27.82128 | 724 | 浙江省铜铃山国家森林公园 |
| 9 | Qinglongshan | 112.5341 | 23.17020 | 320 | 广东省鼎湖山自然保护区的百丈岭、青龙山 |
| 10 | Tiantongshan | 121.7855 | 29.80710 | 199 | 浙江省天童山 |
Extraction of climate data
After preparing the information of locations, this function will check the coordinates, and download the corresponding raster tiles of climate data from Worldclim. At last it exports a data.frame.
#Example data in this package
data("locdata")

#extraction of climate data
plotdata <- clim_extract(locdata)| No | Altitude | Location | Lon | Lat | Type | 1 | 2 | 3 | 4 | 5 | 6 | 7 | 8 | 9 | 10 | 11 | 12 |
|---|---|---|---|---|---|---|---|---|---|---|---|---|---|---|---|---|---|
| 1 | 2025 | Motuo | 95.3536 | 29.30420 | prec | 10.00 | 22.00 | 38.00 | 93.0 | 114.0 | 230.00 | 241.00 | 216.00 | 187.0 | 72.0 | 12.0 | 7.00 |
| 1 | 2025 | Motuo | 95.3536 | 29.30420 | mean_temp | 10.90 | 11.60 | 15.10 | 18.6 | 21.9 | 24.00 | 24.40 | 24.60 | 23.1 | 20.1 | 16.0 | 12.40 |
| 1 | 2025 | Motuo | 95.3536 | 29.30420 | min_temp | -1.90 | -0.50 | 3.10 | 6.2 | 9.9 | 12.50 | 13.60 | 13.30 | 12.7 | 9.2 | 2.9 | -0.30 |
| 1 | 2025 | Motuo | 95.3536 | 29.30420 | max_temp | 10.90 | 11.60 | 15.10 | 18.6 | 21.9 | 24.00 | 24.40 | 24.60 | 23.1 | 20.1 | 16.0 | 12.40 |
| 2 | 1301 | Wulianshan | 100.5000 | 24.50000 | prec | 12.00 | 16.00 | 20.00 | 35.0 | 75.0 | 173.00 | 204.00 | 193.00 | 126.0 | 98.0 | 47.0 | 18.00 |
| 2 | 1301 | Wulianshan | 100.5000 | 24.50000 | mean_temp | 20.80 | 23.20 | 26.50 | 29.0 | 29.5 | 28.60 | 28.30 | 28.50 | 27.3 | 25.2 | 22.2 | 19.90 |
| 2 | 1301 | Wulianshan | 100.5000 | 24.50000 | min_temp | 5.70 | 7.40 | 10.70 | 14.4 | 17.8 | 20.40 | 20.60 | 20.10 | 18.6 | 16.0 | 11.4 | 7.10 |
| 2 | 1301 | Wulianshan | 100.5000 | 24.50000 | max_temp | 20.80 | 23.20 | 26.50 | 29.0 | 29.5 | 28.60 | 28.30 | 28.50 | 27.3 | 25.2 | 22.2 | 19.90 |
| 3 | 2082 | Wawushan | 102.9167 | 29.50000 | prec | 12.00 | 13.00 | 21.00 | 53.0 | 104.0 | 168.00 | 191.00 | 180.00 | 145.0 | 73.0 | 27.0 | 14.00 |
| 3 | 2082 | Wawushan | 102.9167 | 29.50000 | mean_temp | 4.20 | 5.90 | 10.90 | 15.6 | 18.3 | 19.80 | 22.00 | 21.80 | 17.6 | 13.7 | 9.9 | 5.90 |
| 3 | 2082 | Wawushan | 102.9167 | 29.50000 | min_temp | -4.10 | -2.80 | 1.00 | 5.7 | 9.1 | 11.90 | 14.70 | 14.30 | 11.0 | 7.0 | 2.0 | -2.20 |
| 3 | 2082 | Wawushan | 102.9167 | 29.50000 | max_temp | 4.20 | 5.90 | 10.90 | 15.6 | 18.3 | 19.80 | 22.00 | 21.80 | 17.6 | 13.7 | 9.9 | 5.90 |
| 4 | 1204 | Leibo | 103.4667 | 28.45000 | prec | 13.00 | 16.00 | 21.00 | 53.0 | 97.0 | 156.00 | 180.00 | 195.00 | 121.0 | 72.0 | 31.0 | 15.00 |
| 4 | 1204 | Leibo | 103.4667 | 28.45000 | mean_temp | 7.20 | 9.30 | 14.70 | 19.4 | 22.4 | 24.10 | 26.50 | 26.40 | 21.9 | 17.4 | 13.1 | 8.70 |
| 4 | 1204 | Leibo | 103.4667 | 28.45000 | min_temp | -1.00 | 0.60 | 4.90 | 9.5 | 13.4 | 16.00 | 18.50 | 17.80 | 14.8 | 10.6 | 5.6 | 0.70 |
| 4 | 1204 | Leibo | 103.4667 | 28.45000 | max_temp | 7.20 | 9.30 | 14.70 | 19.4 | 22.4 | 24.10 | 26.50 | 26.40 | 21.9 | 17.4 | 13.1 | 8.70 |
| 5 | 1764 | Longcanggou | 102.8333 | 29.61667 | prec | 14.00 | 16.00 | 24.00 | 54.0 | 104.0 | 166.00 | 211.00 | 209.00 | 152.0 | 76.0 | 30.0 | 16.00 |
| 5 | 1764 | Longcanggou | 102.8333 | 29.61667 | mean_temp | 5.90 | 7.80 | 13.00 | 17.7 | 20.7 | 22.40 | 24.60 | 24.30 | 19.9 | 15.9 | 11.7 | 7.50 |
| 5 | 1764 | Longcanggou | 102.8333 | 29.61667 | min_temp | -2.30 | -0.80 | 3.40 | 7.7 | 11.3 | 14.20 | 16.80 | 16.20 | 13.0 | 8.7 | 4.0 | -0.50 |
| 5 | 1764 | Longcanggou | 102.8333 | 29.61667 | max_temp | 5.90 | 7.80 | 13.00 | 17.7 | 20.7 | 22.40 | 24.60 | 24.30 | 19.9 | 15.9 | 11.7 | 7.50 |
| 6 | 1917 | Jinfoshan | 107.1933 | 29.00017 | prec | 27.00 | 28.00 | 55.00 | 125.0 | 188.0 | 202.00 | 180.00 | 167.00 | 152.0 | 116.0 | 67.0 | 30.00 |
| 6 | 1917 | Jinfoshan | 107.1933 | 29.00017 | mean_temp | 0.90 | 2.00 | 7.20 | 12.6 | 16.3 | 18.70 | 21.90 | 21.90 | 17.4 | 12.7 | 7.6 | 3.20 |
| 6 | 1917 | Jinfoshan | 107.1933 | 29.00017 | min_temp | -4.20 | -3.10 | 0.90 | 5.6 | 9.7 | 12.60 | 15.10 | 14.80 | 11.5 | 7.2 | 2.2 | -2.10 |
| 6 | 1917 | Jinfoshan | 107.1933 | 29.00017 | max_temp | 0.90 | 2.00 | 7.20 | 12.6 | 16.3 | 18.70 | 21.90 | 21.90 | 17.4 | 12.7 | 7.6 | 3.20 |
| 7 | 863 | Xishui | 106.4667 | 28.30000 | prec | 16.00 | 17.00 | 35.00 | 90.0 | 158.0 | 175.00 | 154.00 | 141.00 | 116.0 | 92.0 | 49.0 | 21.00 |
| 7 | 863 | Xishui | 106.4667 | 28.30000 | mean_temp | 6.70 | 8.10 | 13.20 | 19.0 | 22.9 | 25.00 | 28.30 | 28.40 | 23.7 | 18.3 | 13.3 | 8.60 |
| 7 | 863 | Xishui | 106.4667 | 28.30000 | min_temp | 1.60 | 2.70 | 6.40 | 10.7 | 14.4 | 17.60 | 20.00 | 19.20 | 16.3 | 12.1 | 7.4 | 3.10 |
| 7 | 863 | Xishui | 106.4667 | 28.30000 | max_temp | 6.70 | 8.10 | 13.20 | 19.0 | 22.9 | 25.00 | 28.30 | 28.40 | 23.7 | 18.3 | 13.3 | 8.60 |
| 8 | 724 | Tonglingshan | 119.8598 | 27.82128 | prec | 57.00 | 92.00 | 149.00 | 169.0 | 238.0 | 279.00 | 158.00 | 213.00 | 206.0 | 93.0 | 66.0 | 39.00 |
| 8 | 724 | Tonglingshan | 119.8598 | 27.82128 | mean_temp | 8.60 | 9.40 | 13.00 | 18.1 | 21.7 | 24.90 | 28.50 | 27.90 | 24.5 | 20.2 | 15.4 | 11.10 |
| 8 | 724 | Tonglingshan | 119.8598 | 27.82128 | min_temp | 0.60 | 2.00 | 5.30 | 10.3 | 14.5 | 18.10 | 20.80 | 20.30 | 17.4 | 12.5 | 7.3 | 2.20 |
| 8 | 724 | Tonglingshan | 119.8598 | 27.82128 | max_temp | 8.60 | 9.40 | 13.00 | 18.1 | 21.7 | 24.90 | 28.50 | 27.90 | 24.5 | 20.2 | 15.4 | 11.10 |
| 9 | 320 | Qinglongshan | 112.5341 | 23.17020 | prec | 44.00 | 73.00 | 112.00 | 198.0 | 314.0 | 288.00 | 221.00 | 260.00 | 153.0 | 77.0 | 40.0 | 38.00 |
| 9 | 320 | Qinglongshan | 112.5341 | 23.17020 | mean_temp | 15.80 | 16.30 | 19.50 | 23.7 | 27.5 | 29.60 | 31.00 | 30.60 | 29.3 | 26.3 | 22.1 | 18.30 |
| 9 | 320 | Qinglongshan | 112.5341 | 23.17020 | min_temp | 8.30 | 9.80 | 13.30 | 17.8 | 21.1 | 23.10 | 23.60 | 23.50 | 22.2 | 18.9 | 13.9 | 9.50 |
| 9 | 320 | Qinglongshan | 112.5341 | 23.17020 | max_temp | 15.80 | 16.30 | 19.50 | 23.7 | 27.5 | 29.60 | 31.00 | 30.60 | 29.3 | 26.3 | 22.1 | 18.30 |
| 10 | 199 | Tiantongshan | 121.7855 | 29.80710 | prec | 52.00 | 74.00 | 106.00 | 119.0 | 141.0 | 178.00 | 113.00 | 151.00 | 173.0 | 78.0 | 64.0 | 44.00 |
| 10 | 199 | Tiantongshan | 121.7855 | 29.80710 | mean_temp | 4.45 | 5.45 | 8.85 | 14.2 | 18.8 | 22.75 | 26.75 | 26.55 | 22.9 | 18.1 | 12.7 | 7.05 |
| 10 | 199 | Tiantongshan | 121.7855 | 29.80710 | min_temp | 1.20 | 2.10 | 5.40 | 10.5 | 15.3 | 19.70 | 23.50 | 23.40 | 19.8 | 14.8 | 9.1 | 3.30 |
| 10 | 199 | Tiantongshan | 121.7855 | 29.80710 | max_temp | 7.70 | 8.80 | 12.30 | 17.9 | 22.3 | 25.80 | 30.00 | 29.70 | 26.0 | 21.4 | 16.3 | 10.80 |
The exported data.frame includes 5 kinds of information of
locations(as which in the data.frame imported), and values of 4 kinds of
climate factors across 12 months. Note that some locations don’t
have data of annual average temperature(not included in
geodata), so they would be replace by values averaged by
annual average minimum temperature and annual average maximum
temperature, as the method in Walter & Lieth climatic
diagram.
An data.frame stores in the data plotdata of this
package, as an example of the function export.
Except the temp folders, the storage path could be modified to prevent the delection or redownloading of climate data.
# add your path
plotdata <- clim_extract(locdata, path= "G:/climplot")
Hereto clim_extact have obtained all essential
information for the Walter & Lieth climatic diagram drawing.
Climatic diagram drawing
The function clim_plot can draw the Walter & Lieth
climatic diagram plotting in different styles of color scheme and
information presentation. It refers to the function
diagwl()of a CRAN package climatol.
Walter & Lieth climatic diagram drawing of a single location
Take the data plotdata as an example, and import them
into clim_plot.
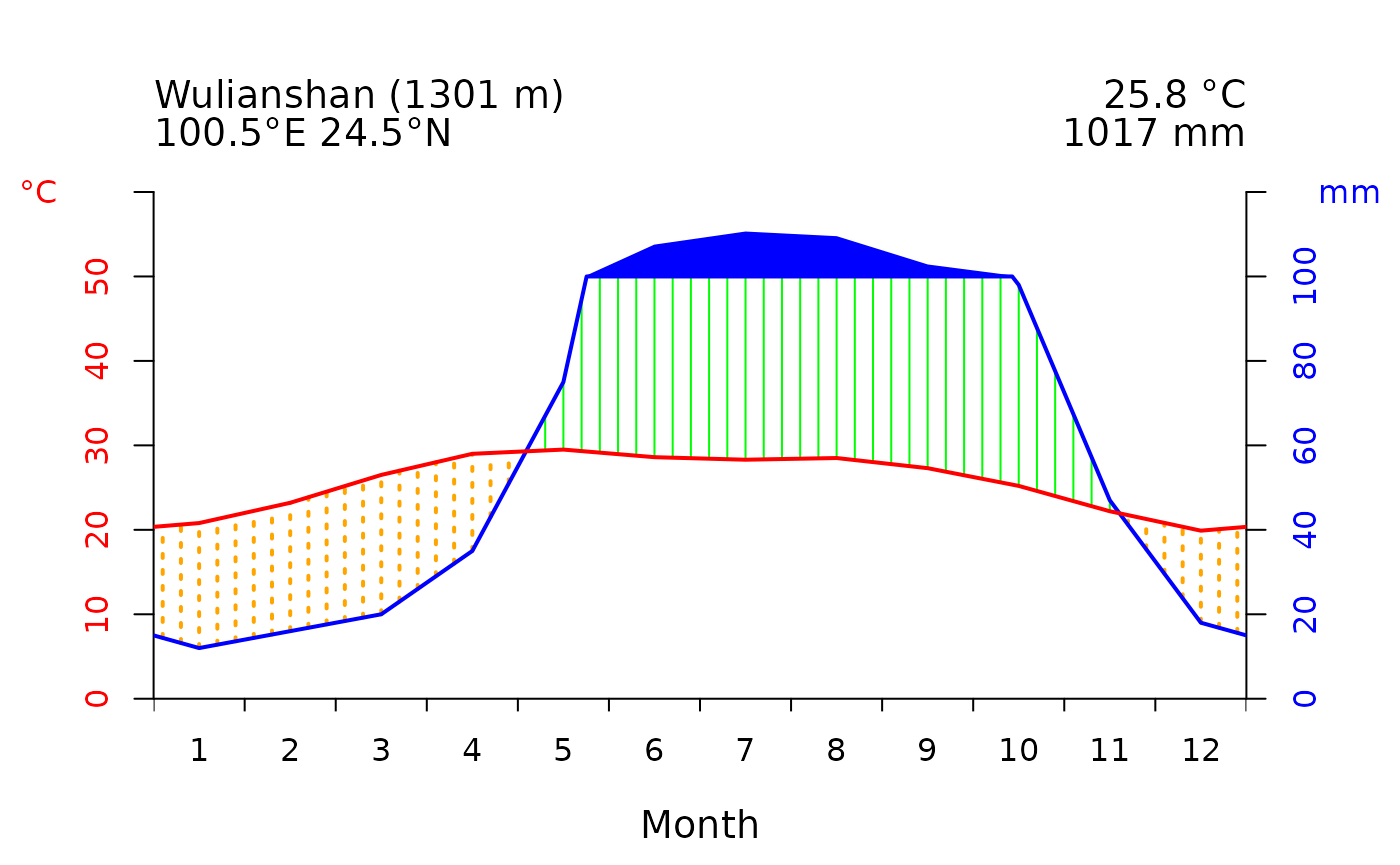
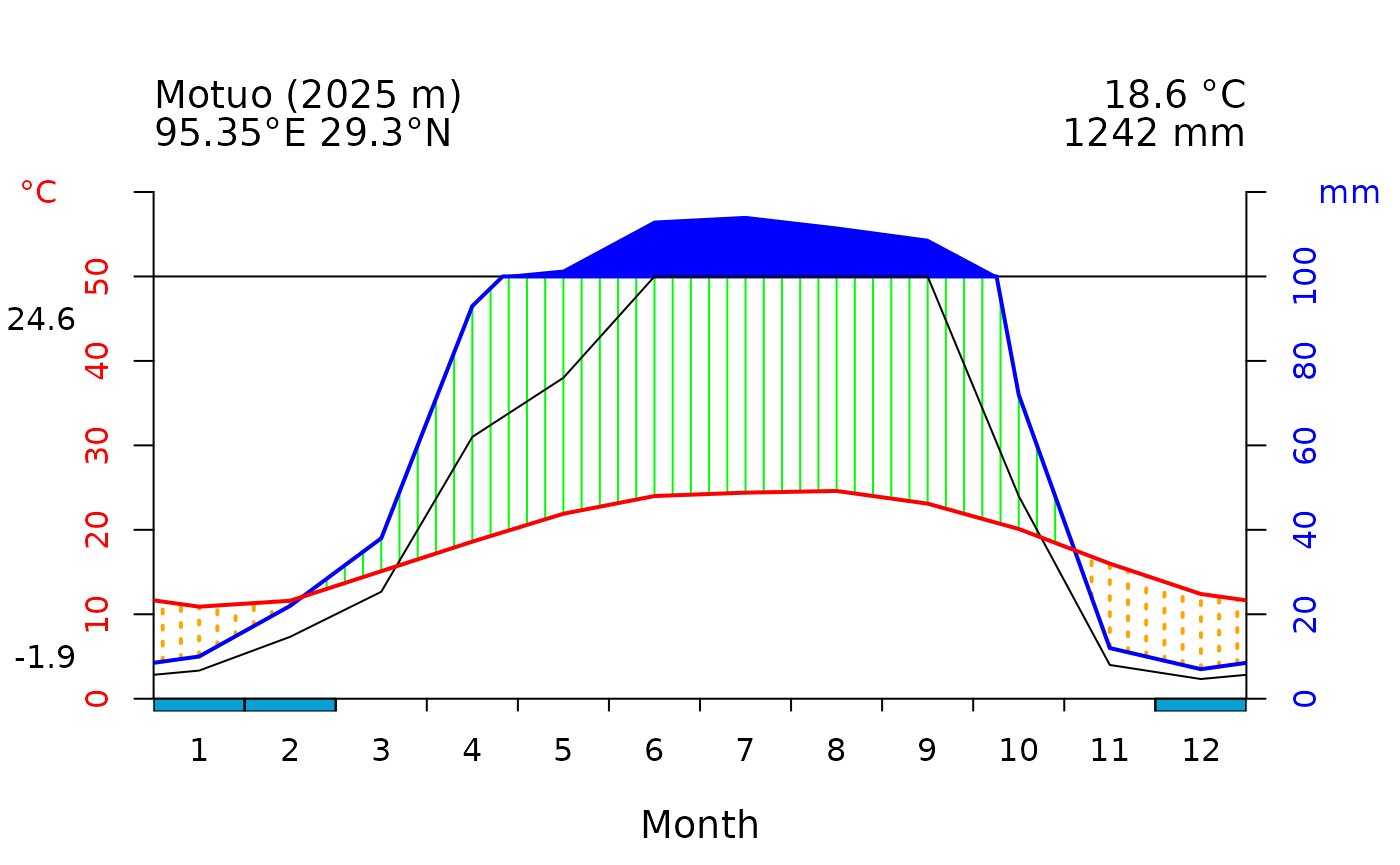
Fig 1 The example of diagram drawing
In the figure above:
The red curve represents the annual variation of temperature, and blue one represents of precipitation variation. These two curves form two kinds of patches indicating humidity and aridity levels. The line-filled patches represent humid seasons while those with scattered points represent arid seasons. The polygon filled with the color same as precipitation curve indicates months with precipitation over 100mm, displaying the wet season.
The information on the left top includes the name, the altitude and the coordinate of the location. The right top are the values of annual mean temperature and mean precipitation.
Solution to drawing for serveral location
clim_plotonly supports drawing diagrams for one location
at a time, as we recommend checking each plot individually, and
importing multiple vectors of climate data increases the risk of errors.
Therefore, if you require automated plotting for several locations,
utilizing a loop is recommended:
data("plotdata")
list <- unique(plotdata$No)
par(mfrow = c(1, 1))
for (i in 1:5) {
  k <- list[i]
  sub <- subset(plotdata, No == k)
  clim_plot(
    data = sub, ylabel = TRUE,
    ylab1 = "Temperature(\U{00B0}C)",
    ylab2 = "Precipitation(mm)",
    line_p50 = TRUE
  )
}
To save the plot you can build a frame for picture before plotting:
Other tips of climatic diagram plotting
Plotting the frosty months
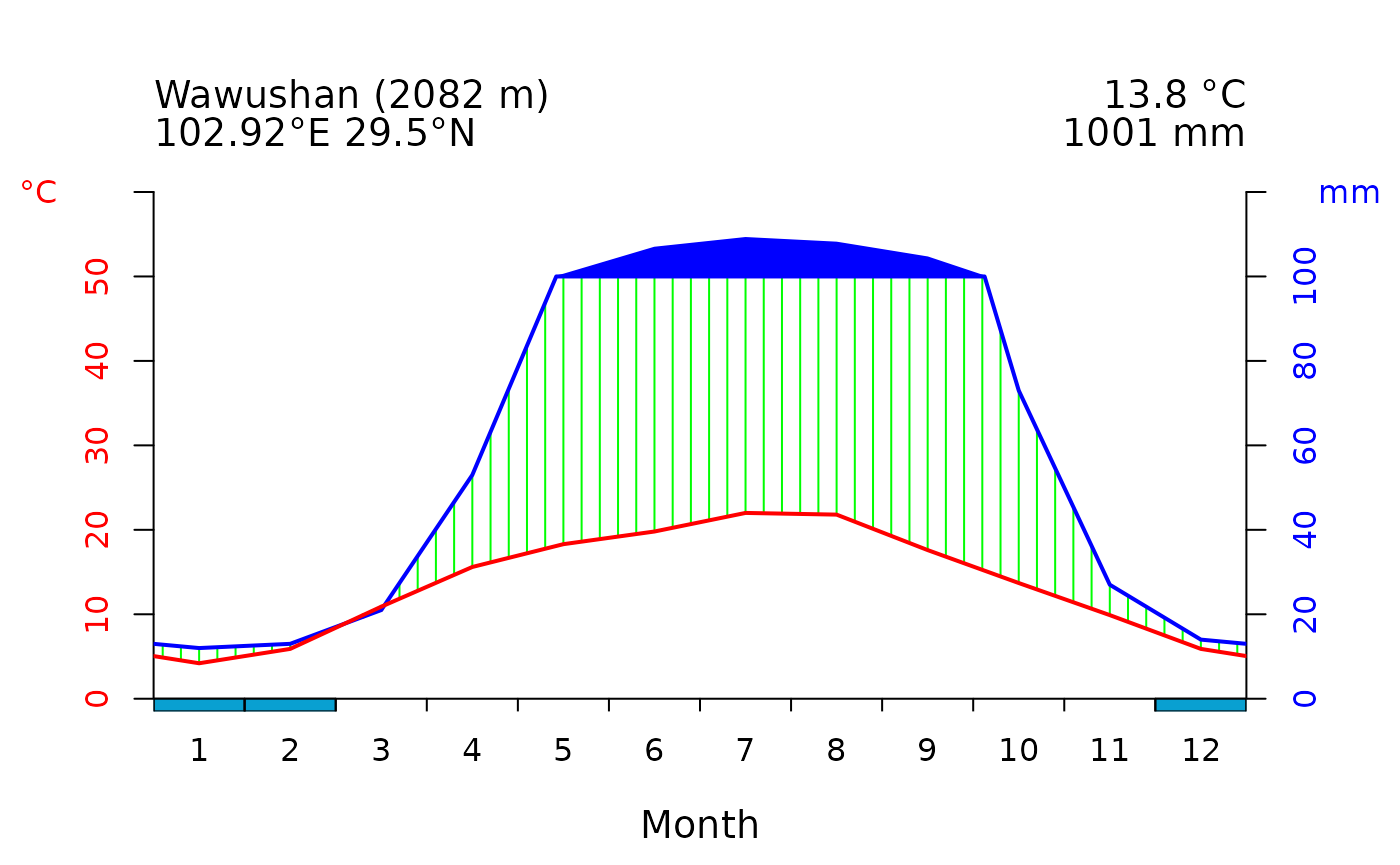
Fig 2 The example of marking frosty months
The blocks with dark blue color on x-axis represent the months with confirmed frost.
Color and axis modification
The color and the axis labels could be customized to meet specific requirements.
It is possible to adjust the colors of line of temperature and precipitation, as well as patches of humidity, aridity, wet season and frosty month blocks.
loc <- subset(plotdata, No == 1)
clim_plot(loc,
  pcol = "#8DB6CD", tcol = "#FF6A6A", wcol = "#4EEE94",
  dcol = "#EEB422", fcol = "#8A2BE2", showfrost = TRUE)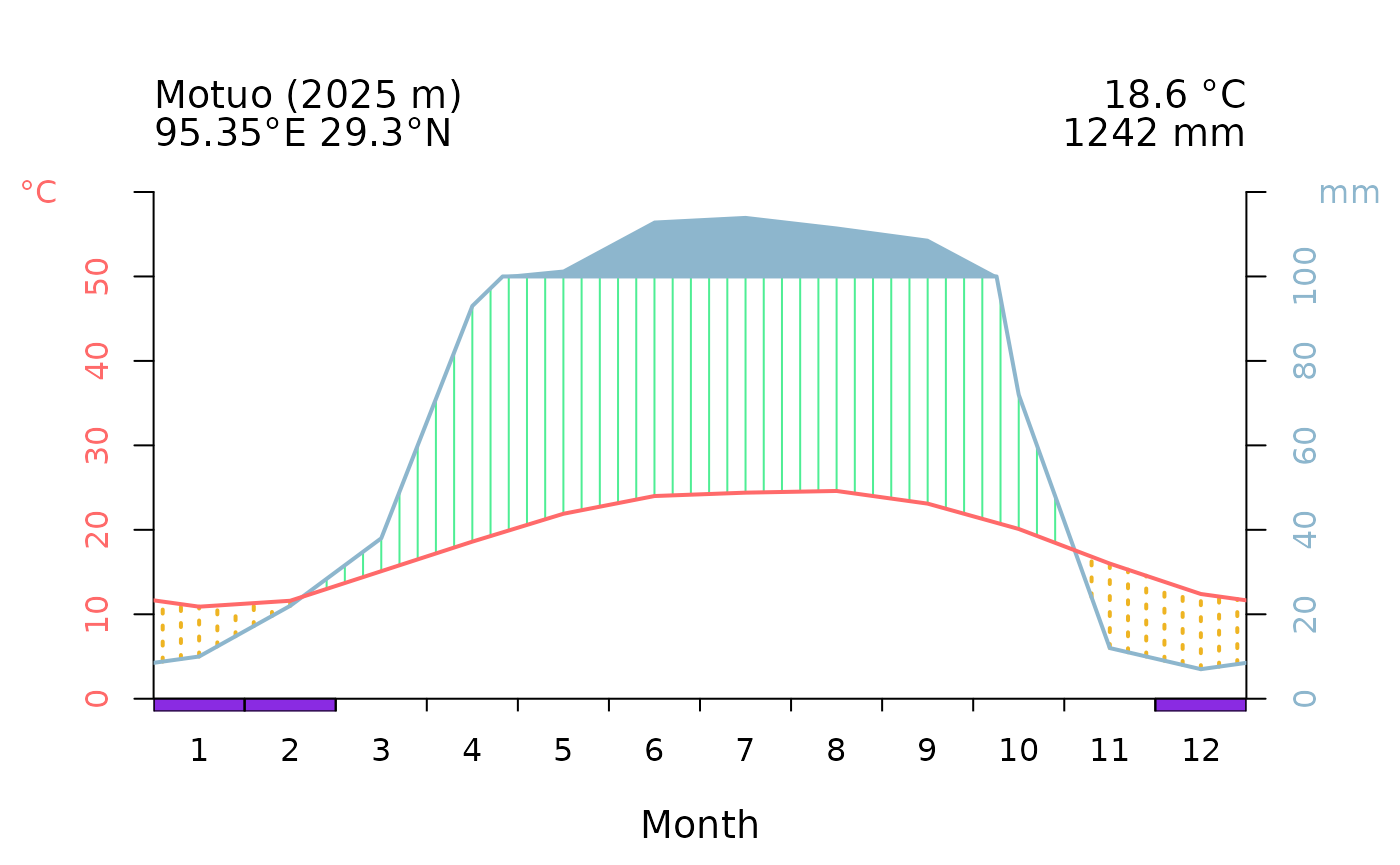
Fig 3 The example of color modification
Additionally, the display of axis labels can be controlled and custom
labels can be imported using parameters ylabel,
ylab1, ylab2 mlab and
xlab .
loc <- subset(plotdata, No == 1)
clim_plot(loc,
  xlab = "月份", mlab = "en", ylabel = TRUE,
  ylab1 = "Temperature(\U{00B0}C)",
  ylab2 = "Precipitation(mm)", showfrost = TRUE
)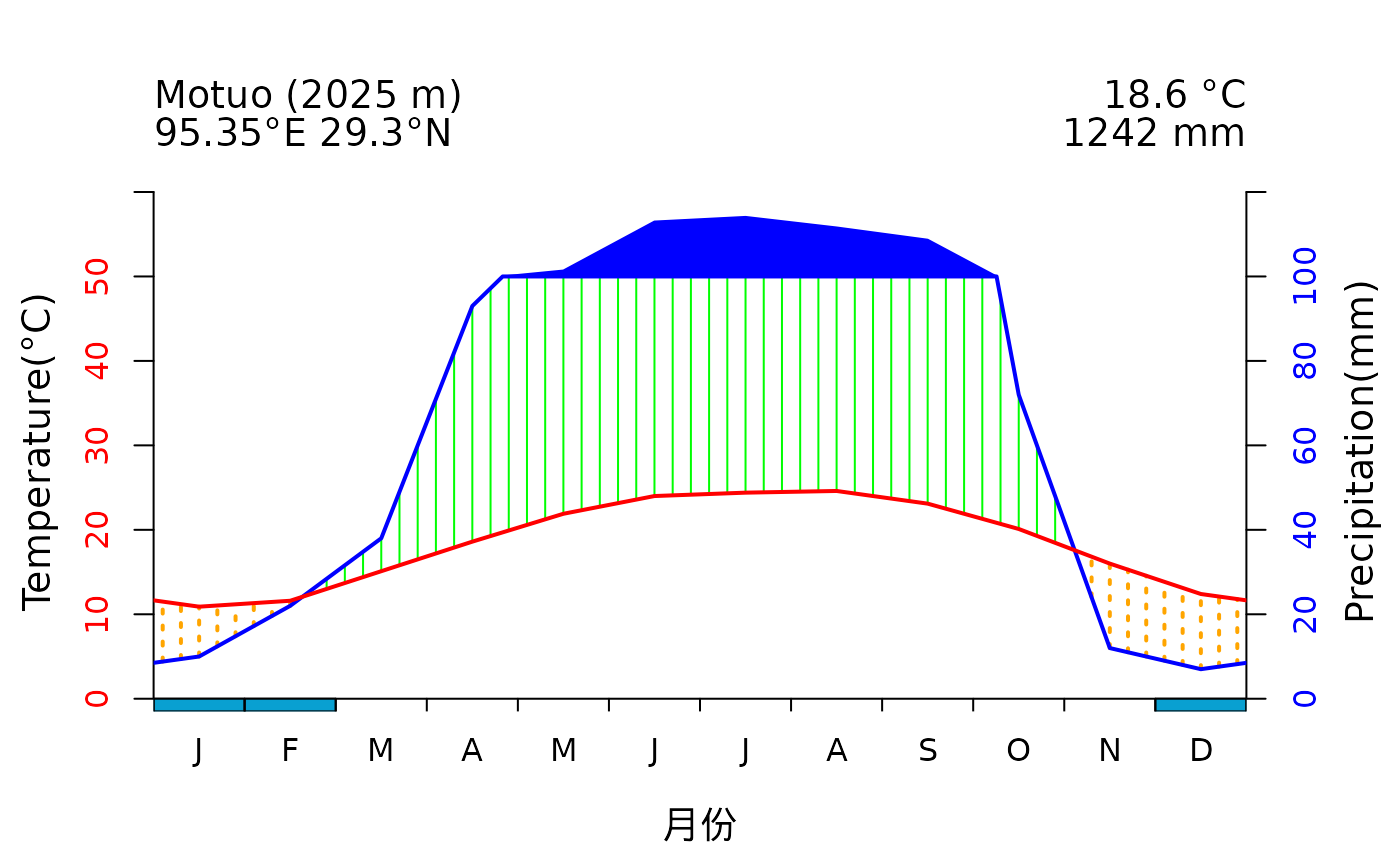
Fig 4 The example of axis labels modification
Reference
Guijarro J A (2023). climatol: Climate Tools (Series Homogenization and Derived Products), 4.0.0., https://CRAN.R-project.org/package=climatol.
Pizarro M, Hernangómez D, Fernández-Avilés G (2021). climaemet: Climate AEMET Tools. doi:10.32614/CRAN.package.climaemet.
Fick, S.E. and R.J. Hijmans, (2017). WorldClim 2: new 1km spatial resolution climate surfaces for global land areas. International Journal of Climatology 37 (12): 4302-4315.
Harris, I., Osborn, T.J., Jones, P.D., Lister, D.H. (2020). Version 4 of the CRU TS monthly high-resolution gridded multivariate climate dataset. Scientific Data 7: 109.
Walter H & Lieth H (1960): Klimadiagramm Weltatlas. G. Fischer, Jena.
Session information
## R version 4.5.1 (2025-06-13)
## Platform: x86_64-pc-linux-gnu
## Running under: Ubuntu 24.04.2 LTS
##
## Matrix products: default
## BLAS:   /usr/lib/x86_64-linux-gnu/openblas-pthread/libblas.so.3
## LAPACK: /usr/lib/x86_64-linux-gnu/openblas-pthread/libopenblasp-r0.3.26.so;  LAPACK version 3.12.0
##
## locale:
##  [1] LC_CTYPE=C.UTF-8       LC_NUMERIC=C           LC_TIME=C.UTF-8
##  [4] LC_COLLATE=C.UTF-8     LC_MONETARY=C.UTF-8    LC_MESSAGES=C.UTF-8
##  [7] LC_PAPER=C.UTF-8       LC_NAME=C              LC_ADDRESS=C
## [10] LC_TELEPHONE=C         LC_MEASUREMENT=C.UTF-8 LC_IDENTIFICATION=C
##
## time zone: UTC
## tzcode source: system (glibc)
##
## attached base packages:
## [1] stats     graphics  grDevices utils     datasets  methods   base
##
## other attached packages:
## [1] kableExtra_1.4.0 knitr_1.50       dplyr_1.1.4      climplot_0.4.0
##
## loaded via a namespace (and not attached):
##  [1] sass_0.4.10        generics_0.1.4     xml2_1.3.8         class_7.3-23
##  [5] KernSmooth_2.23-26 stringi_1.8.7      digest_0.6.37      magrittr_2.0.3
##  [9] evaluate_1.0.3     grid_4.5.1         RColorBrewer_1.1-3 fastmap_1.2.0
## [13] plyr_1.8.9         jsonlite_2.0.0     e1071_1.7-16       DBI_1.2.3
## [17] viridisLite_0.4.2  scales_1.4.0       codetools_0.2-20   textshaping_1.0.1
## [21] jquerylib_0.1.4    cli_3.6.5          rlang_1.1.6        units_0.8-7
## [25] cachem_1.1.0       yaml_2.3.10        tools_4.5.1        ggplot2_3.5.2
## [29] vctrs_0.6.5        R6_2.6.1           proxy_0.4-27       lifecycle_1.0.4
## [33] classInt_0.4-11    stringr_1.5.1      fs_1.6.6           ragg_1.4.0
## [37] pkgconfig_2.0.3    desc_1.4.3         pkgdown_2.1.3      terra_1.8-54
## [41] pillar_1.10.2      bslib_0.9.0        gtable_0.3.6       glue_1.8.0
## [45] Rcpp_1.0.14        sf_1.0-21          systemfonts_1.2.3  xfun_0.52
## [49] tibble_3.3.0       tidyselect_1.2.1   rstudioapi_0.17.1  farver_2.1.2
## [53] htmltools_0.5.8.1  rmarkdown_2.29     svglite_2.2.1      compiler_4.5.1
## [57] geodata_0.6-2